
Weekly Market Commentary - Week Ending Saturday, October 24, 2026
This week’s commentary is more of a broader topic that I want to discuss that I feel is important in today’s market environment. Rather than focusing solely on the week’s headlines, I want to step back and examine a structural feature of large-cap growth investing that has become increasingly relevant: concentration risk in widely followed growth indexes and what it means for how we access growth over the long term.
Last Week’s Rotation, Concentration Risk, and Positioning Between the Indexes
U.S. equities finished the week ending October 23 with a split outcome that highlighted ongoing rotation beneath the surface of the major indexes. The S&P 500 declined approximately 0.5%, the Nasdaq Composite fell roughly 0.7%, and the Dow Jones Industrial Average rose about 0.4% for its third consecutive weekly gain. The Russell 2000 advanced approximately 2%, outperforming its large-cap counterparts. Energy stocks benefited from higher oil prices driven by geopolitical supply concerns, while technology and AI-related names faced renewed pressure amid continued scrutiny of capital-spending intensity, valuation levels, and the sustainability of the recent AI investment cycle. Certain defensive, value-oriented, and smaller-capitalization areas held up better or advanced. The week was volatile rather than directional, with leadership continuing to broaden beyond the largest growth stocks. Investors looked ahead to a heavy earnings calendar—including several major technology companies—and the upcoming Federal Reserve meeting.
This short-term rotation sits against a larger year-to-date divergence that has become one of the more instructive developments of 2026. Through late October, the Russell 1000 Growth Index has returned roughly 1.5%, while the broader Russell 1000 Index has advanced approximately 12%. The nearly ten-percentage-point gap is not the product of a sudden, broad-based decline in growth-oriented businesses. It is, to a substantial degree, the result of concentration risk that is structurally embedded in the Russell 1000 Growth Index.
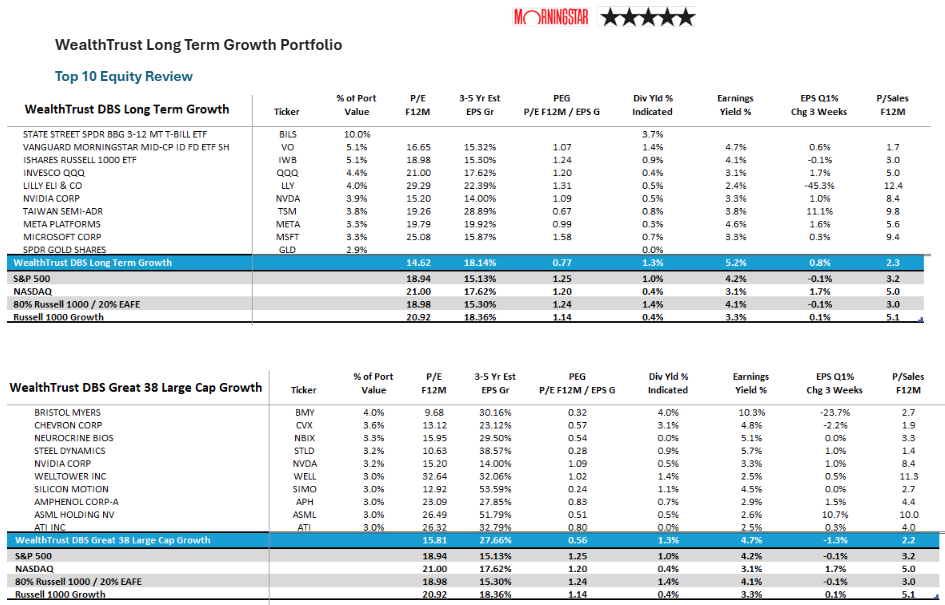
The Russell 1000 Growth Index is constructed to capture the growth-oriented portion of the largest U.S. companies. In practice, that construction has produced a highly concentrated portfolio. Recent data indicate that the top 10 holdings represent approximately 57% to 60.5% of the index. NVIDIA alone accounts for roughly 15% to 15.7%(one of our largest holdings at less that 4%), Apple, the two share classes of Alphabet, Microsoft, Broadcom, Meta Platforms, Tesla, Micron Technology, and Advanced Micro Devices make up the bulk of the remaining top-tier weight. Technology and related communication-services exposures routinely exceed 50% of the index. Although the index contains roughly 370 names, the effective number of stocks—once large weights are properly accounted for—is far smaller. What is presented as a diversified large-cap growth benchmark functions, in substance, as a portfolio whose results are heavily determined by a limited number of mega-cap companies.
This structure creates a form of risk that is not always obvious in strong markets but becomes highly visible when the largest constituents do not lead. In 2026, the mega-cap growth complex has not generated the relative outperformance that defined much of the prior multi-year period. Other segments of the large-cap universe—particularly value-oriented companies and sectors outside pure technology—have participated more fully in the market’s advance. The Russell 1000 Value Index has delivered substantially higher year-to-date returns than its growth counterpart. Because the broad Russell 1000 includes both growth and value names in market-capitalization proportions, it has captured that wider participation and produced a double-digit gain. The Growth Index, constrained by its heavy concentration in a narrower set of names, has lagged. Last week’s relative strength in the Dow and small-cap indexes, alongside continued pressure on growth-heavy technology names, is consistent with this broader pattern of rotation away from the heaviest growth weights. The underperformance of the Nasdaq relative to the Dow and Russell 2000 during the week further illustrated how concentrated growth exposure can lag when leadership broadens.
Concentration risk in this context is not limited to the possibility of a sharp drawdown. It also appears as a persistent opportunity cost. When the largest holdings pause, lag, or experience relative multiple compression—even while the underlying businesses remain fundamentally healthy—the entire index underperforms a less concentrated alternative. Investors who hold the Russell 1000 Growth through an index fund or ETF have experienced this dynamic directly. Their exposure has been closer to a concentrated position in a subset of mega-cap technology and related companies than to a diversified expression of large-cap growth. The difference between a low-single-digit return and an approximately 12% return over more than nine months is material for most client portfolios, especially when the concentrated index also carries higher volatility.
It is useful to distinguish between the operating quality of the largest companies and the risk characteristics of the index that owns them in large size. Many of the top holdings continue to generate strong absolute earnings and free cash flow. NVIDIA’s position in AI infrastructure, for example, remains strategically important. The issue is not that these companies have become poor investments when considered individually. The issue is that an index methodology that assigns them such large weights converts company-specific outcomes into portfolio-level outcomes. Solid but not exceptional relative performance from the top names produces mediocre index results even if a large number of other growth companies are advancing. The reverse is equally true: strong performance from the largest weights can produce outsized index returns that mask weakness elsewhere. In either case, the index functions less as a broad representation of growth and more as a reflection of the market capitalizations of its largest constituents.
Passive ownership risk of many passive indexes(anybody remember 2000 to 2002 when the S&P 500 was initially 48% technology) embeds these concentration levels without any mechanism to moderate them. Active management, by contrast, can size positions according to research conclusions rather than pure market capitalization. It can also reduce or exit exposure when valuations become extended, earnings-revision trends turn negative, or risk metrics deteriorate. The performance gap that has developed in 2026 is a practical demonstration that concentration is not a free option; it carries a measurable cost when the largest names do not dominate returns.
WealthTrust DBS Long Term Growth: Built to Perform Between the Indexes
WealthTrust’s DBS Long Term Growth Strategy is constructed as a diversified Growth at a Reasonable Price (GARP) portfolio. GARP seeks companies that combine above-average growth characteristics with valuations that remain reasonable relative to their growth rates, earnings quality, and expected returns. It is neither an unconstrained high-growth approach that is indifferent to price nor a pure value strategy. The objective is long-term growth participation with explicit attention to entry points, ongoing valuations, and position-size discipline.
By design, the strategy is positioned to perform somewhere between the highly concentrated Russell 1000 Growth Index and the broader Russell 1000 Index. It maintains meaningful exposure to growth-oriented companies, including select high-quality technology and growth names, but does so with substantially lower concentration than the Russell 1000 Growth. Position sizes are managed so that no single name or small cluster of names can dominate outcomes to the degree seen in the growth benchmark. At the same time, the strategy’s broader diversification and valuation discipline allow it to participate more fully in periods when leadership broadens beyond the largest mega-cap growth stocks—precisely the environment that has characterized much of 2026 and was visible again last week. The result is a portfolio intended to capture a meaningful portion of growth upside while reducing the opportunity cost and volatility that can arise from extreme concentration. Over full market cycles, this middle path seeks to deliver competitive growth exposure without fully inheriting the concentrated risk profile of the Russell 1000 Growth or the lower growth tilt of a pure broad-market or value-oriented index.
Diversification is a core design element supporting this positioning. Rather than allowing market capitalization to determine the majority of portfolio risk, the strategy maintains a less concentrated exposure than the Russell 1000 Growth Index. Sector exposures are monitored to avoid the extreme technology concentration that characterizes the growth benchmark. The result is a portfolio whose returns are driven by a wider set of earnings outcomes rather than the relative performance of a handful of mega-cap stocks.
The GARP framework incorporates continuous attention to earnings revisions, valuation metrics, and risk characteristics. Companies whose earnings estimates are being revised higher, whose growth rates remain attractive relative to price, and whose balance-sheet and cash-flow profiles support the investment thesis are favored. Positions are subject to sell rules when valuations become stretched, earnings revisions turn negative, or risk metrics deteriorate. This discipline is intended to limit the duration of holdings that no longer meet the strategy’s criteria and to redeploy capital into more attractive opportunities. In an environment where the largest growth names can remain elevated in price for extended periods, the ability to adjust weights and exit when conditions change is a structural difference from passive index ownership and supports the strategy’s aim of performing between the two indexes.
The contrast with the Russell 1000 Growth is therefore both quantitative and qualitative. The index’s top-ten concentration of roughly 57% to 60% means that a relatively small number of stocks determine most of the index’s return in any given period. The DBS Long Term Growth Strategy is constructed to avoid that degree of dependence while still providing growth exposure. Its broader diversification reduces the impact of any single name’s underperformance while still allowing participation in attractive growth companies. At the same time, the GARP emphasis on reasonable valuations seeks to limit the multiple-compression risk that can affect high-priced growth stocks when growth expectations moderate or interest-rate conditions shift. The combination is designed to participate in long-term growth while managing the concentration and valuation risks that have been visible in the Russell 1000 Growth Index during 2026 and that continued to influence last week’s trading.
Broader market conditions this year have reinforced the relevance of the distinction. Sector leadership has been more dispersed than in the peak periods of AI-driven concentration. Areas with more balanced or value-oriented characteristics have contributed meaningfully to the Russell 1000’s stronger return. An allocation delivered almost entirely through the Russell 1000 Growth has had limited participation in that broader advance. A diversified GARP strategy positioned between the two indexes is structured to have greater flexibility to own attractive growth companies across sectors and to adjust as relative opportunities change. That flexibility does not guarantee outperformance in every period, but it does change the sources of risk and return relative to a concentrated passive benchmark and seeks to capture a more balanced share of the market’s gains.
Looking ahead, concentration levels in the Russell 1000 Growth are unlikely to normalize quickly under the current index methodology. Market-cap weighting, combined with the continued large absolute size of the leading technology companies, tends to perpetuate high top-heavy weights. Periodic reconstitution and any capping adjustments may modestly mitigate the extremes, but they do not eliminate the structural feature. Investors should therefore treat the Russell 1000 Growth as what it has become: a concentrated large-cap growth vehicle rather than a broad, diversified growth benchmark. Those who want growth exposure without accepting current concentration levels can consider active approaches that manage position sizes and valuation discipline, such as the DBS Long Term Growth Strategy, which is built to perform somewhere between the concentrated growth index and the broader large-cap market.
The year-to-date divergence between the Russell 1000 Growth and the Russell 1000, reinforced by last week’s relative underperformance in growth-heavy indexes, is not an anomaly to be set aside. It is a clear illustration of how index construction can create persistent differences in outcome even within the same broad capitalization range. Concentration risk is not always visible in strong markets, when the largest weights are also the strongest performers. It becomes visible—and costly—when relative leadership broadens or shifts. In 2026 that shift has occurred. Portfolios that rely heavily on passive Russell 1000 Growth exposure have captured less of the market’s advance than those with broader or more actively managed large-cap exposure. Understanding the source of that difference and evaluating alternatives such as a diversified GARP strategy designed to perform between the two indexes, is a practical step toward aligning growth allocations with both return objectives and risk tolerances.
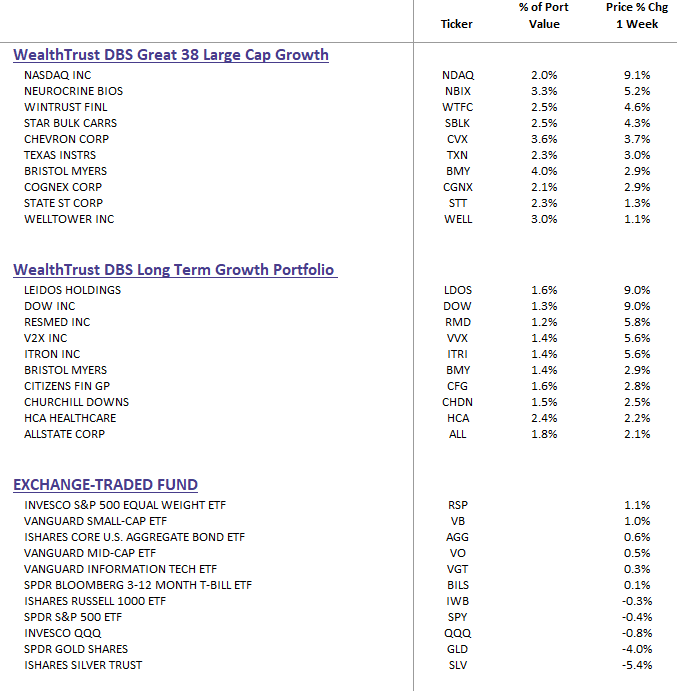
DBS Long-Term Growth & DBS Great 38 Large Cap Growth Top Ten and Benchmark Weekly Performance Summary