Weekly Commentary for the week ending October 25, 2025
Weekly Market Commentary, October 25, 2025
Today we'll not only recap the key market movements and economic releases but also dig deeper into what they really signal for investors like you. We'll explore the implications behind the headlines, why certain trends are gaining traction, and how they fit into the broader bull market narrative. Let's jump in.
Stocks advanced solidly for the week, pushing past the noise from escalating U.S.-China trade tensions and a sharp spike in oil prices triggered by fresh U.S. sanctions on Russia's two biggest oil producers. This resilience is telling: it shows investors are increasingly tuning out short-term geopolitical drama in favor of the underlying strength in corporate America. Small-cap stocks, as tracked by the Russell 2000, and mid-caps via the S&P Midcap 400, stole the show by outperforming their large-cap peers—think a 2.5% gain for the Russell versus just 1.2% for the S&P 500. This shift hints at a broadening rally, where smaller companies, often more tied to domestic growth, are starting to catch up after lagging for months. In the S&P 500 itself, information technology surged nearly 3%, buoyed by AI optimism, while energy climbed 2.8% on those oil headlines—but don't read too much into that; it's more a reaction to supply fears than a structural boom. On the flip side, defensive sectors like utilities and consumer staples dipped 0.5% to 1%, as investors rotated out of safe havens amid hopes for continued economic expansion. Overall, this week's action underscores a market that's selective but forward-looking, rewarding adaptability over fear.
Now, let's unpack the inflation data, which arrived cooler than expected and could be a game-changer for policy. The U.S. government shutdown—now dragging into its third week—has thrown a wrench into routine data releases, creating an information vacuum that's amplified market jitters. Yet, in a nod to priorities, the Bureau of Labor Statistics pulled furloughed workers back online to drop September's CPI figures on October 24, over a week late, just in time for the Social Security Administration's annual cost-of-living adjustment calculations affecting 70 million Americans. Headline inflation ticked up to 3.0% year-over-year from August's 2.9%, but crucially, it undershot economists' 3.1% forecast. Core inflation, stripping out fickle food and energy, eased to 3.0% from 3.1%—a subtle but meaningful slowdown. What does this mean? It's a clear sign that the Fed's aggressive rate-hiking campaign is finally gaining traction on price pressures, without tipping the economy into contraction. Housing costs, which make up about a third of CPI, decelerated sharply, with owners' equivalent rent—the key metric—seeing its smallest monthly bump since early 2021. Goods inflation cooled too, thanks to softer used-car prices, even as tariff-vulnerable items like furniture and apparel perked up modestly—their weight in the index is small, so no big red flag there. Services ex-housing also softened, lifted by falling auto insurance rates. In essence, this print isn't just "good news"—it's a dovish signal that reinforces our view of a Fed that's data-dependent but leaning toward easing, potentially unlocking more upside for risk assets.
Shifting to business sentiment, October's preliminary PMI data painted a picture of accelerating activity, but with some cautionary undertones worth heeding. S&P Global's flash indexes showed the composite PMI—blending manufacturing and services—climbing to 54.8 from September's 53.9, the 33rd straight month above the 50-expansion threshold. Services, the economy's powerhouse, hit a three-month high at 55.2, driven by robust new orders and hiring—evidence that consumer spending remains a bright spot, even if lower-income households are feeling the pinch from higher rates. Manufacturing edged up to 52.2 from 52.0, a modest improvement suggesting supply chains are stabilizing post-tariff threats. But here's the interpretive layer: manufacturer optimism plunged to its second lowest since mid-2024, dragged down by tariff anxieties and policy fog from the shutdown. This divergence—strong output but fading confidence—could foreshadow a "wait-and-see" mode if trade wars reignite, potentially capping capex in export-heavy sectors. For investors, it's a reminder to favor domestically oriented plays over global cyclicals right now, while keeping an eye on how November's trade deadlines play out.
In the bond market, we saw a classic yield curve twist: short-end rates like the 1- and 3-year Treasuries climbed about 10 basis points, reflecting bets on near-term Fed pauses amid sticky core data, while the 10-year yield dipped 5 basis points to around 4.1%. Treasuries choppily trended lower early in the week on shutdown worries, then reversed as inflation hopes faded. Bond prices fall when yields rise, so longer-duration bonds actually gained a bit— a subtle vote of confidence in disinflation. Traders at firms like T. Rowe Price are pricing in a prolonged shutdown through the month-end, which could delay jobs data and muddy the Fed's path. This uncertainty is why stocks are scaling that "wall of worry": our bull market just turned three, bottoming in October 2022 after a 25% inflation-fueled plunge, then turbocharged by ChatGPT's November debut that supercharged tech. The wall's gotten steeper lately—China frictions ahead of November deadlines, a labor slowdown hidden by data blackouts, and AI stock valuations that scream "frothy" at 30x forward earnings. Yet, these are classic mid-cycle hurdles, not deal-breakers. They test resolve but often precede fresh legs higher, as long as earnings deliver—which we'll circle back to.
So, how does this bull stack up historically? From the October 2022 trough, the S&P 500 is up 90% pricewise, or 98% with dividends—a stellar run, no question. But context matters: over the last 80 years, the prior 12 bulls averaged 200% gains over five years, with eight lasting beyond three years and the 2009-2020 epic spanning 11. Ours? Middle-aged and spry, not overripe. History teaches that bulls don't expire from age—they succumb to recessions or Fed hikes. With inflation cooling and no recession signals (unemployment steady at 4.1% per private proxies), we see clear skies through 2026. This isn't blind optimism; it's grounded in a setup where policy pivots from restrictive to neutral, unleashing pent-up demand.
Earnings now take center stage, poised to propel the bull's next act. The S&P's eyeing a third straight 10%+ year, inflating P/E ratios to 22x—lofty, echoing late-90s vibes, but not bubble territory yet. Valuations can't stretch forever; enter earnings as the new driver. U.S. profits are humming at 8-10% growth despite headwinds, a testament to margin resilience and pricing power. Q3 season's heating up post-banks, with 60% of S&P firms reporting soon—including most Magnificent 7. Expect 15% EPS growth from the tech titans versus 6.7% for the rest and 8.5% index-wide. Early reads? Consumers are holding firm, especially affluent ones shrugging off rates; credit's pristine, and M&A's reviving on deal-friendly valuations. Tech's spotlight: AI capex hitting $400 billion, or a third of S&P total spend—Nvidia, Microsoft, et al. are all-in. Returns? Patchy so far, but Wall Street's patient, pricing in productivity miracles. If Q3 shows even nascent ROI, it'll justify premiums and broaden the rally; misses could spark that healthy pullback.
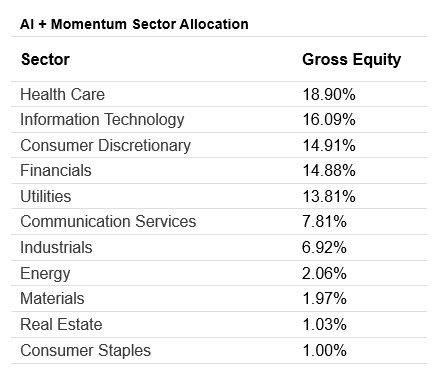
Our AI Target Sector Allocation below is based on AI momentum sector trend analysis and AI news analysis
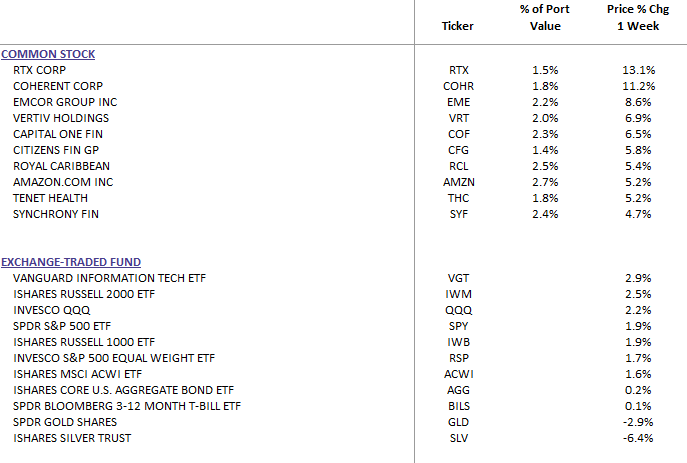
DBS Long Term Growth Top Ten and Benchmark Weekly Performance:
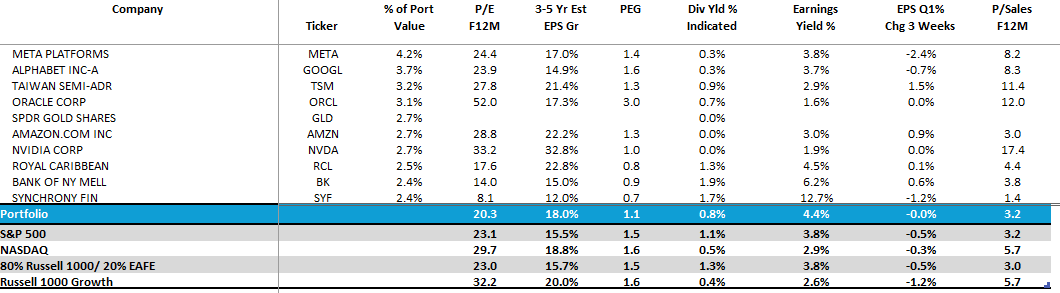
DBS Long Term Growth Portfolio Top Ten Holdings and Valuation Statistics: