
Weekly Commentary for the week ending March 28, 2026
Today we'll break down a volatile and headline-driven week in the markets, dominated by shifting developments in U.S.-Iran diplomatic efforts, a sharp rotation in market leadership, and persistent concerns over energy prices and inflation.
Let's start with the major U.S. indices, which closed out their fifth consecutive losing week—the longest such streak in nearly four years. The S&P 500 fell about 1.7% on Friday to close near 6,369, bringing its weekly loss to roughly 2.1%. The index now sits about 8.7% below its January all-time high. The Dow Jones Industrial Average dropped 1.7% for the week, closing around 45,167, while the Nasdaq Composite was hit harder, declining 3.2% weekly and falling into correction territory (down over 10% from recent peaks). The Russell 2000 small-cap index showed relative resilience at times but still ended lower.
The market's path this week was a classic "headline ping-pong." Early gains came on reports of progress in U.S.-Iran ceasefire talks, including a formal proposal and a brief 10-day pause on energy-related strikes announced by the administration. Stocks rallied on Monday as oil prices initially dropped nearly 10% on relief. However, Iran denied active negotiations, tensions resurfaced, and oil rebounded, sending equities lower. By week's end, even a deadline extension couldn't fully restore confidence, leading to broad selling—especially in growth-oriented names.
This volatility underscores how closely tied markets remain to geopolitical outcomes in the Middle East. A sustained ceasefire could ease energy pressures and support risk assets, but prolonged uncertainty keeps the environment fragile.
Beneath the surface, a clear market rotation continued and even intensified. Small-cap and value stocks outperformed the broader indices during the early-week relief rally, while mega-cap technology names lagged. This broadening of leadership—away from the largest growth stocks toward more "average" companies—has been a theme building since early 2026. It suggests investors are rotating into areas perceived as more resilient to higher-for-longer interest rates and inflation risks. Sectors like energy benefited from the oil rebound, while defensives and industrials showed pockets of strength.
On the sector front, energy was a standout, with refiners and oilfield services names gaining as crude prices swung wildly but ended the week down only modestly (roughly 5% after the initial drop). Technology and communication services faced headwinds, with chip stocks like Nvidia, AMD, and Intel dropping several percent amid broader growth concerns. Financials, industrials, and consumer staples offered mixed but relatively better performance in the rotation. Healthcare and utilities provided some defensive ballast but couldn't fully offset the selling pressure.
Turning to fixed income, Treasury yields moved higher as oil-driven inflation fears resurfaced and risk appetite waned. The 10-year Treasury yield climbed to around 4.44% by week's end—the highest level in months—reflecting reduced demand for safe-haven bonds amid the headline swings. The 2-year yield also rose, steepening parts of the curve modestly. This move in yields added pressure to rate-sensitive sectors like real estate and high-growth tech. The VIX (fear gauge) spiked at times, closing the week elevated near or above 27, signaling ongoing investor caution.
Commodities told a similar story. Oil (Brent and WTI) experienced extreme volatility: plunging on ceasefire hopes, then recovering as diplomacy faltered. It remains elevated overall due to the premium and concerns around supply routes like the Strait of Hormuz. Gold held firm as a traditional hedge, while Bitcoin and cryptocurrencies showed resilience, trading in a consolidation range around $66,000–$72,000 despite the equity weakness—acting somewhat as a digital hedge in uncertain times.
Macro backdrop: The Federal Reserve's March meeting (held mid-month) kept the federal funds rate steady in the 3.50%–3.75% range, as widely expected. Policymakers noted solid underlying economic activity but highlighted elevated inflation risks, now projecting PCE inflation at 2.7% for 2026 (up from prior forecasts) due in part to energy shocks. They still anticipate one rate cut later this year, but the path remains highly data-dependent and uncertain given the war's potential impacts on growth and prices. Recent jobs data has been soft, with weak payrolls and a steady unemployment rate around 4.4%, creating a delicate balancing act for the Fed between inflation and employment mandates.
So, what does this all mean for investors?
This week reinforced that geopolitical risk is the dominant driver in the near term. Markets are highly sensitive to any news on U.S.-Iran talks—good headlines lift risk assets and crush oil; bad ones do the opposite. The ongoing rotation toward value, small caps, and energy suggests the market is pricing in a world of stickier inflation and less reliance on mega-cap growth for returns. Breadth has improved at times, which is often a positive long-term signal, but the downtrend in major averages (lower highs and lows) keeps the technical picture cautious.
Looking ahead to next week, the calendar is relatively light on major U.S. data, but watch for any fresh developments out of the Middle East. Traders will eye oil prices closely; as a real-time barometer of diplomatic progress. Earnings season is largely behind us, so focus shifts to macro signals and policy comments. Any signs of cooling in energy markets or clearer Fed guidance could help stabilize sentiment.
In summary, it was a challenging week for equities, with the S&P 500 and Dow extending losses amid ceasefire uncertainty and rising energy costs. The bright spot has been the continued broadening of market participation and resilience in certain value-oriented and commodity-linked areas. Volatility is likely to remain elevated until the geopolitical picture clarifies. Please remember, we still have 16% liquidity available to deploy at the appropriate time.
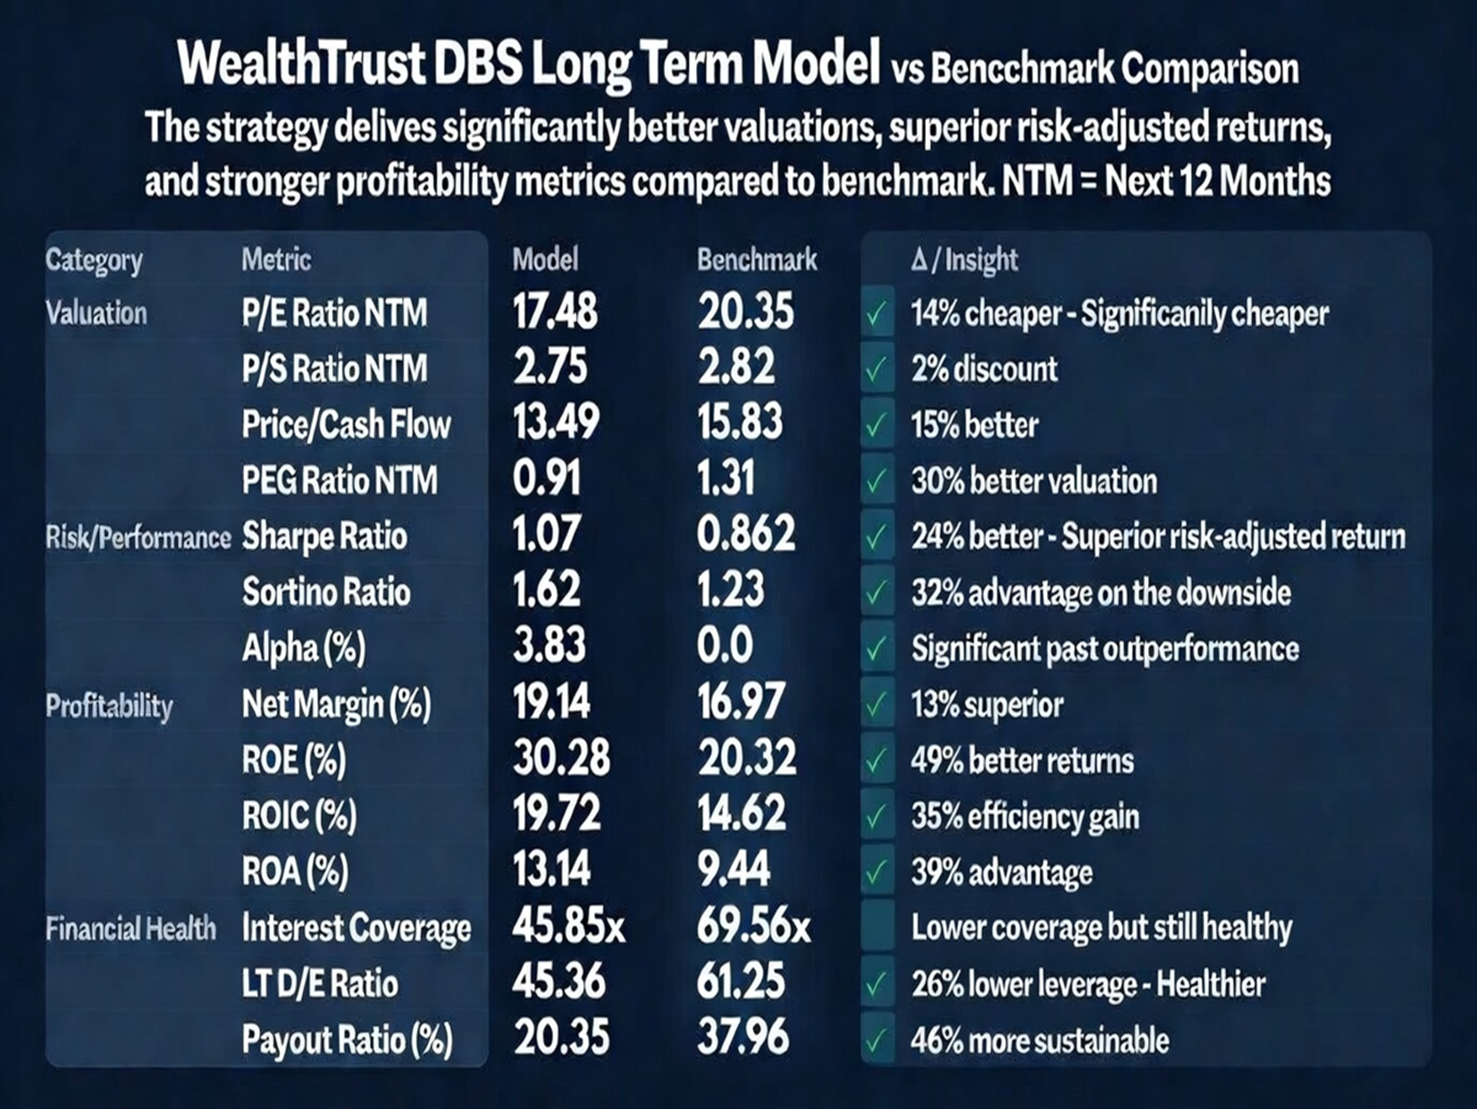
Here's a checkup of our DBS Long Term Growth Strategy versus the S&P 500.
Similar to a physical checkup for an individual, this analysis compares the strategy across four key areas: Valuation, Risk/Performance, Profitability, and Financial Health.
Out of 14 total metric comparisons, 13 are favorable for the DBS Long Term Growth Strategy ✅.
Michael Lee, our CFA and Senior Investment Officer, has noted that this is one of his favorite analyses to share with advisors and clients
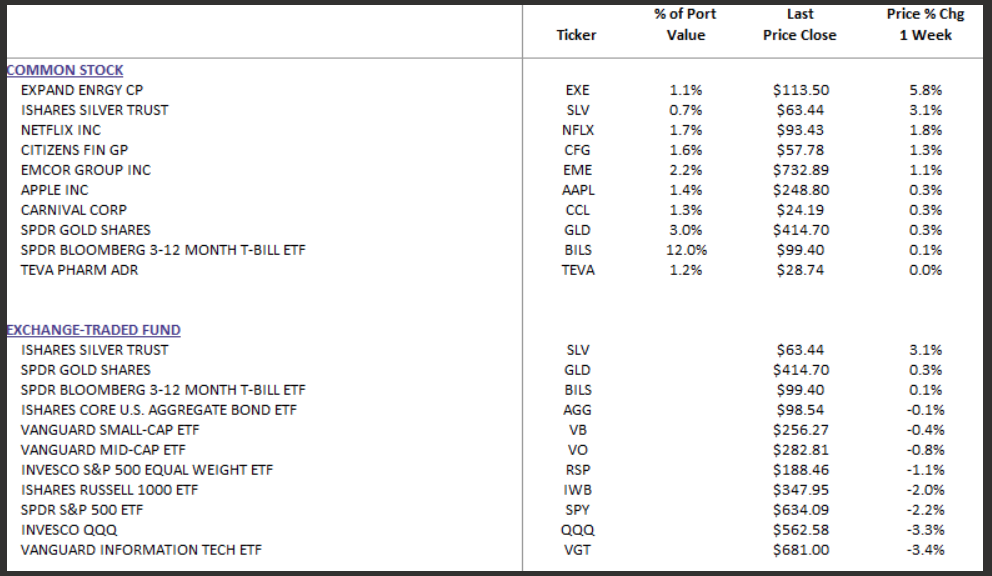
DBS Long Term Growth Top Ten and Benchmark Weekly Performance:
As always, this environment calls for disciplined risk management, diversification, and a long-term perspective. Geopolitical shocks can create opportunities for patient investors, but they also demand caution.