
Weekly Commentary for the week ending March 14, 2026
As we head into the weekend of March 14, 2026, financial markets are navigating a turbulent period. The ongoing U.S.-Israel military operation against Iran—now in its second week—has reshaped the global risk landscape. Supply disruptions in the Persian Gulf, including halted tanker traffic through the Strait of Hormuz and targeted attacks on regional energy infrastructure, have sent crude oil prices surging, with benchmarks pushing toward or above $100 per barrel at points during the week. This energy shock has amplified inflation fears, pushed Treasury yields higher, flattened the yield curve, and forced investors to delay expectations for Federal Reserve rate cuts.
U.S. equities showed relative resilience compared to international peers but still posted meaningful declines for a third consecutive week. Broader sentiment reflected a mix of geopolitical anxiety, stagflation concerns, and selective sector strength in energy and certain technology sub-sectors.
Major Index Performance (Week Ending March 13, 2026)
- S&P 500: -1.28% (closing near 6,673)
- Dow Jones Industrial Average: -1.77% (closing near 46,678, dipping below 47,000 for the first time in 2026)
- Nasdaq Composite: -1.13% (closing near 22,312)
- Russell 2000 (small caps): -1.75%
Year-to-date, the major indices remain in negative territory; the S7P 500 is down 3.12% with the Nasdaq showing the deepest drawdown at around -4.76%. International developed markets (MSCI EAFE) fell -1.66%, while emerging markets held up slightly better at -0.52%, though both have seen sharper monthly declines.
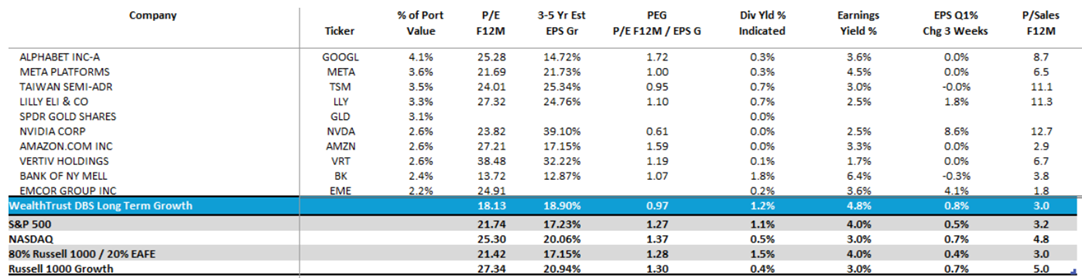
Our flagship WealthTrust DBS Long-Term Growth Strategy is down approximately 1% year-to-date through mid-March 2026, outperforming the broader market amid heightened volatility driven by the ongoing U.S.-Israel conflict with Iran and the resulting surge in energy prices.
This modest drawdown reflects disciplined positioning and a defensive posture: we currently maintain 15% liquidity (11% in BILS—the SPDR Bloomberg 3-12 Month T-Bill ETF, providing stable, short-duration Treasury exposure with yields around 4%—and 4% in cash). This dry powder positions us well to deploy capital opportunistically once we identify attractive entry points during the current sell-off.
Particularly compelling opportunities are emerging in several oversold sectors that have borne the brunt of recent pressure:
- Travel and leisure — hit hard by fears of prolonged geopolitical uncertainty impacting consumer spending and international demand.
- Banks and financials — pressured by rising Treasury yields, a flattening curve, and broader risk-off sentiment.
- Technology (especially software and certain large-cap names) — facing rotation away from high-valuation growth stocks amid AI disruption concerns and macro headwinds.
While broader indices like the S&P 500 (down roughly 2-3% YTD in various reports, hovering near 6,630-6,670) and Nasdaq have logged deeper losses amid oil-driven inflation fears and stagflation worries, our strategy's relative resilience underscores the value of patience and selectivity.
We view the current environment as a classic tactical pullback rather than a structural bear market—provided the Middle East conflict shows signs of containment and energy prices stabilize. Our team continues to monitor developments closely, focusing on valuation resets, improving technicals, and fundamental catalysts in these beaten-down areas.
We remain committed to a long-term growth mandate and believe this liquidity reserve will enable us to capitalize on mispricing as clarity emerges.
The week's trading was volatile: early pressure from oil spikes and escalation fears gave way to brief relief on comments suggesting the conflict might be contained or nearing resolution (including dovish signals from U.S. leadership), only for sentiment to sour again on persistent supply risks and mixed economic data.
Key Drivers: Geopolitics and Energy
The dominant theme was the Middle East conflict. Iranian responses and disruptions forced production cuts in the Persian Gulf, triggering the largest weekly oil price jump on record in the early phase. Emergency reserve releases had limited impact, and fears of a prolonged energy crunch kept upward pressure on prices.
This translated directly to markets:
- Energy stocks led the S&P 500 for a second straight week, providing a defensive buffer.
- Broader risk assets faced headwinds as higher energy costs fed inflation worries and reduced the likelihood of near-term monetary easing.
Economic Data Highlights
Economic releases painted a mixed picture, with some resilience overshadowed by warning signs:
- February nonfarm payrolls came in sharply weak: -92,000 jobs (vs. expectations of modest gains), pushing the unemployment rate to 4.4%.
- ISM Services Index rose to 56.1 (expansionary), but prices paid components in both manufacturing and services signaled building cost pressures.
- Inflation data (including February CPI details) remained in focus but was largely in-line, offering limited new direction amid the oil-driven narrative.
- Personal spending showed some strength, but revisions to prior GDP growth were sluggish.
Fed and Interest Rates Outlook
With oil-driven inflation risks rising, markets have pushed out rate-cut expectations significantly. Fed funds futures now price in roughly 44–50 basis points of easing for the remainder of 2026 (down from ~60 bps earlier), with many analysts clustering around 50 bps total in cuts (potentially starting mid-year, e.g., June/September).
The March 17–18 FOMC meeting is widely expected to deliver no change, with the focus shifting to updated economic projections and commentary on how geopolitical/energy factors alter the dual mandate outlook. The 10-year Treasury yield climbed notably (ending the week around 4.14%, up ~20 bps recently), reflecting higher term premiums.
Sector and Theme Notes
- Winners: Energy (continued leadership), select semiconductors/technology (strong earnings support in pockets, e.g., AI-related demand holding firm).
- Pressure points: Cyclicals sensitive to growth fears, homebuilders/banks (hit by higher yields), and broad international exposure.
- Broader leadership has broadened somewhat away from mega-cap tech, with the equal-weighted S&P 500 outperforming the cap-weighted version in recent periods.
Crypto Corner
Digital assets demonstrated notable resilience relative to traditional risk markets. Bitcoin held around the $68,000–$70,000 zone (with brief pushes toward $74,000 on short squeezes), while Ethereum stabilized near $2,000. Spot Bitcoin ETFs saw renewed inflows in parts of the week (over $500M+ at peaks), though flows turned choppy later. Crypto appears to be behaving more like a high-beta macro asset tied to inflation break evens than a pure safe-haven play amid the turmoil.
Looking Ahead
Next week brings the March FOMC decision (March 17–18), fresh CPI data, and continued headlines from the Middle East. Key questions:
- Will oil prices stabilize or extend higher?
- Can conflict containment narratives regain traction?
- How will the Fed characterize the shifting inflation/growth balance?
Markets have historically recovered relatively quickly from geopolitical shocks unless accompanied by recession (not the base case here, though prolonged $100+ oil would raise those odds). Volatility (VIX elevated but not extreme) suggests positioning remains cautious, with energy and defensive pockets likely to retain favor if uncertainty lingers.
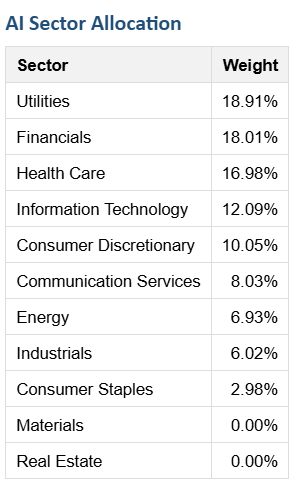
The AI + Momentum Sector Allocation strategy leverages artificial intelligence to dynamically optimize portfolio weights across U.S. equity sectors, combining predictive analytics with momentum signals to target outperforming areas while maintaining broad diversification. This AI-driven approach aims to enhance risk-adjusted returns by rotating toward high-momentum sectors amid evolving AI themes.
As stated previously, we believe the AI Sector Allocation below reflects a short-term rotation away from financials, consumer discretionary (travel& leisure) and technology as long as there is short term resolution to the current geopolitical conflict. Either way we have liquidity to buffer our portfolios while identifying buying opportunities in oversold sectors.
DBS Long Term Growth Top Ten and Benchmark Weekly Performance:
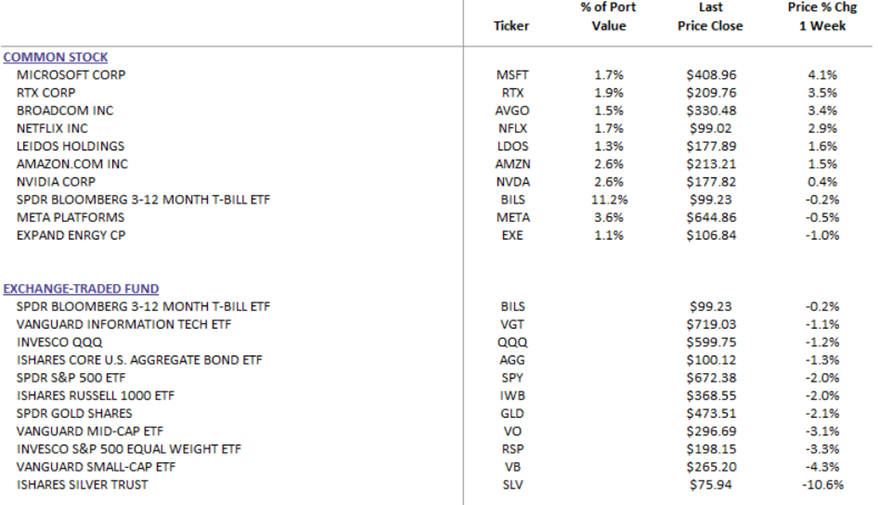
WealthTrust Long Term Growth Portfolio | Top 10 Equity Review
In summary, stay nimble; developments in the Gulf could swing sentiment rapidly in either direction. This has been a challenging stretch, but underlying fundamentals in many areas remain solid beneath the near-term noise
The WealthTrust DBS Long-Term Growth Strategy held up better (down ~1% YTD) with a 15% liquidity buffer, viewing the sell-off as tactical and highlighting buying opportunities in oversold sectors like travel/leisure, banks, and select tech once geopolitical risks ease.