Weekly Commentary for the week ending April 18, 2026
U.S. equity markets delivered a strong performance for much of the week, driven by hopes of de-escalation in the Middle East, only to confront fresh volatility late on Friday and into Saturday as Iran reversed course on the Strait of Hormuz. The S&P 500 surged approximately 4.5% for the week through Friday's close, reaching around 7,126 and briefly trading above 7,100. The Nasdaq Composite outperformed with gains near 6.8%, extending a notable winning streak and closing near 24,468. The Dow Jones Industrial Average rose about 3.2%, ending near 49,447, while the small-cap Russell 2000 showed broadening participation with solid gains on Friday.
Investor sentiment swung dramatically on Friday after Iran’s Foreign Minister declared the Strait “completely open” for commercial vessels during the ongoing Israel-Lebanon ceasefire period. This triggered a sharp drop in oil prices—Brent crude fell as much as 9-10% in a single session—and fueled a broad risk-on rally in equities. However, early Saturday morning (April 18), Iran’s military announced it had reimposed “strict control” over the waterway, reversing the reopening in response to the ongoing U.S. naval blockade of Iranian ports. Reports emerged of Iranian Revolutionary Guard gunboats firing on a tanker attempting to transit, with no injuries reported but ships turning away amid VHF radio warnings declaring the strait closed again.
This reversal—coming less than 24 hours after optimistic announcements from both Iranian officials and President Trump—has injected immediate uncertainty, with oil prices likely rebounding in early trading and equity futures facing pressure.
Geopolitics Takes Center Stage: From Hope to Reversal
The week began with lingering tensions from the broader U.S.-Iran conflict, including the U.S. blockade of Iranian ports initiated earlier in April. Markets had initially priced in stagflation risks from disrupted energy flows through the Strait of Hormuz, which handles roughly 20% of global oil and LNG trade.
On Friday, de-escalation signals—including Iran’s reopening declaration and Trump’s comments suggesting progress—sparked relief. Oil plunged, easing inflation concerns and boosting risk appetite. Yet Saturday’s developments reversed much of that optimism: Iran cited “repeated breaches of trust” and the continued U.S. blockade (which has forced dozens of vessels to turn around) as justification for reasserting control. The military stated the strait is now under “strict management” until full freedom of navigation for Iranian-linked vessels is restored.
This whiplash highlights the fragile nature of the current ceasefire dynamics. While a broader resolution remains possible, the immediate risk of renewed supply disruptions has returned to the forefront. For these reasons, we continue to maintain approximately 20% of our equity strategies in liquid assets(cash & short-term treasuries) looking for opportunities to buy oversold positions.
Economic Backdrop: Resilient Labor Data Amid Sticky Pressures
Away from geopolitics, U.S. economic data remained relatively supportive:
- March nonfarm payrolls beat expectations with a 178,000 gain, and the unemployment rate edged lower to 4.3%, though wage growth cooled to 3.5% year-over-year.
- Inflation readings have shown modest re-acceleration tied to earlier energy spikes, but cooling wages and potential relief from lower oil (prior to today’s reversal) had tempered stagflation fears.
The Federal Reserve is expected to hold rates steady at its late-April meeting, with markets still pricing in limited easing later in 2026 depending on how the energy situation evolves. Q1 corporate earnings continue to impress, with S&P 500 profits on track for double-digit growth and many beats in tech and financials.
Sector and Asset Class Snapshot
- Technology and growth stocks led gains through Friday, fueled by reduced macro fears and ongoing AI momentum.
- Energy saw sharp intraday swings: a major selloff on Friday’s reopening news, now likely facing a rebound as closure risks resurface.
- Small-caps benefited from improved breadth.
- Commodities: Oil gave up significant ground on Friday (WTI and Brent both dropped sharply from recent highs above $100) but headlines today point to a reversal. Gold stabilized as a safe-haven, while Bitcoin traded in the mid-$70,000s amid shifting risk sentiment.
Market breadth improved modestly, though concentration in leading names persisted.
Outlook: Heightened Volatility as Developments Unfold
This week’s rally reflected markets looking through short-term noise toward corporate resilience and potential de-escalation. However, Saturday’s Strait of Hormuz reversal serves as a stark reminder of how quickly geopolitical events can shift the narrative. Key risks include:
- Prolonged or escalated disruptions to energy flows, which could reignite inflation pressures and weigh on growth.
- The Fed’s upcoming communications and any updates on the U.S. blockade or ceasefire talks.
- Full Q1 earnings guidance, particularly commentary on input costs and supply chain resilience.
- Broader labor market trends if softening emerges beyond recent data.
For investors, the environment calls for caution amid resilience. Focus on quality companies with strong balance sheets, pricing power, and lower sensitivity to energy volatility. Diversification remains essential, as does monitoring real-time developments in the Middle East—markets have shown an ability to shake off shocks when fundamentals hold.
The coming days will bring more earnings reports, Fed-related commentary, and critical updates on the Hormuz situation. Expect continued volatility, with a bias that could swing rapidly depending on whether today’s closure proves temporary or escalates further.
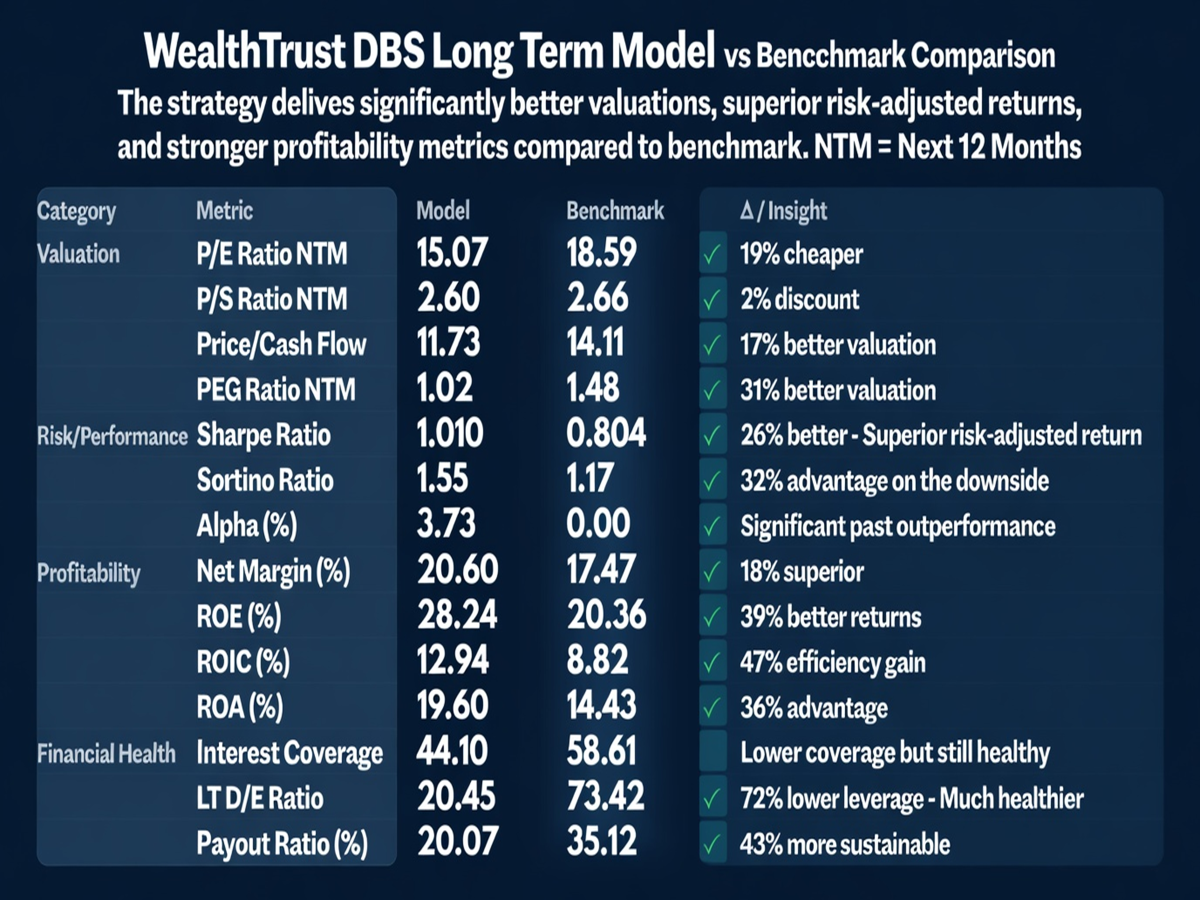
Our Flagship WealthTrust DBS Long Term Growth Strategy, as of Friday, is up approximately 5.5% Year-To-Date and has an annualized return net of fees of approximately 16% since its inception in Sept., 2016. Past performance is no guarantee of future results.
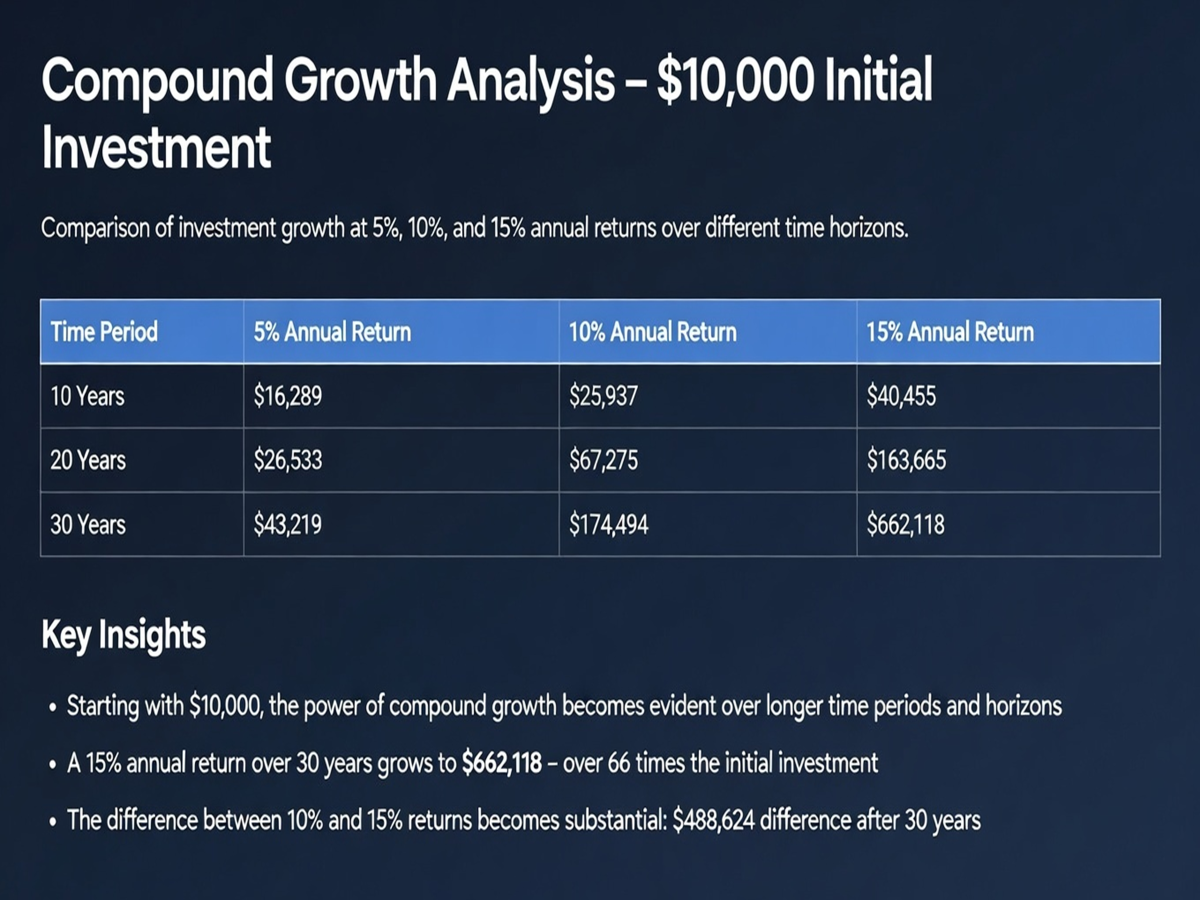
The table below shows the power of compounding at various performance levels for various durations, which I thought you might find interesting.
The image below is as of 3-31-26 and as you can see, our metrics are favorable in 13 of the 14 categories, especially our Next 12-month P/E ratio and PEG ratio (p/e divided by the next 3-5 year earnings growth projection).